|
|
Updated for 2015-16 Season!
Short Description
An Excel workbook that uses macros (user programs) to retrieve current standings from the NHL.com website, sorts them by winning percentages rather than
total points, and calculates some other information so that you can see it at a glance.
Download
Click the link below to Open / Download the Excel workbook.
NHL Standings spreadsheet. (last updated October 1, 2015)
Depending on your Excel macro security settings, you may need to enable macros before you can run them.
Once you have enabled the macros, click the  button to retrieve the current standings. button to retrieve the current standings.
|
Background Information
Unlike the other major professional sports in North America, which publish standings sorted by teams' winning percentages, NHL standings are typically sorted by
teams' points totals.
While this follows tradition, it can be difficult to see which team is really doing better when they have played different numbers of games.
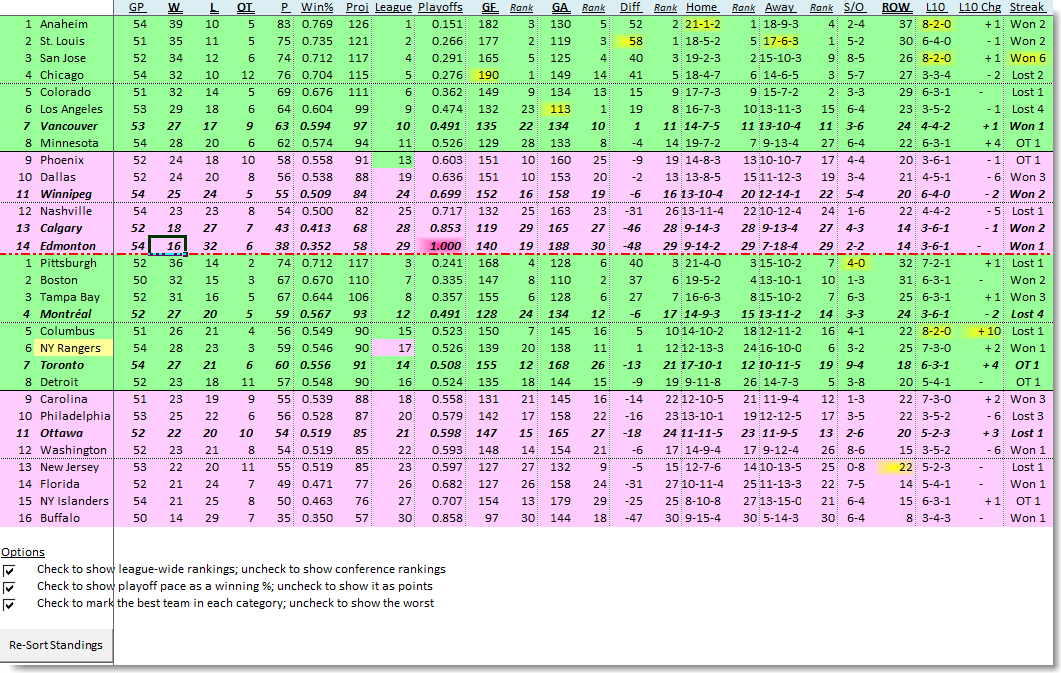
To help me get a better picture of how well (or poorly) my favourite teams are performing, I developed an Excel spreadsheet that downloads the current standings
from the NHL's website and then sorts the teams by winning percentages. This way a team isn't ahead simply because it has played a bunch more games.
The spreadsheet lets you play "what-if" by changing the number of wins, losses, OT losses, goals for, and goals against for each team. For example, you can see whether your team would have
been in a playoff position if they had won a couple of the games that they lost in OT or shootouts.
Of course, it isn't hard to figure that out at the end of the season when all teams have played the same number of games, but during the year this is a great opportunity to
drive yourself to distraction as you realize what those soft goals are costing the team.
During the seaon the spreadsheet calculates the winning percentage that each teams needs for the remainder of the season in order to qualify for the playoffs, assuming that
the other teams continue to win at their current rates.
You can see the playoff target either as a percentage, like baseball standings, or as a full-season points total, similar to current NHL standings.
That is, a playoff target of 0.600 means that the team needs to win at least 6 of every 10 remaining games (or 5 wins and 2 ties, etc.)
to be on track to make the playoffs, based on other teams' results to date.
Once a team in the top eight in the confernce has more points than the projected total for the ninth-place team in the conference, or a team has more points than the projected total for the fourth-place team in its division, its playoff target stops at zero and doesn't go into negative numbers.
Similarly, once a team in the bottom six (West) or eight (East) wouldn't reach the projected total for the 8th-place team even by winning all of its remaining games, its playoff target stops at 1.000 (or 164 points).
After a team has clinched a playoff spot, or been mathematically eliminated, its playoff target changes to "In" or "Out" respectively.
To make it easier to see the team(s) you like (or hate), you can select those teams to be highlighted in the standings.
The spreadsheet also highlights the teams that have the best (or worst): goals for or against; goal differential; home and away records; record over the past 10 games;
winning (losing) streak; regulation & overtime record; and shootout record.
Finally, if you don't like my choices of fonts and background colours you can choose your own.
See below under Options Tab for details on how to make these changs.
Notes & Instructions
Macro Security
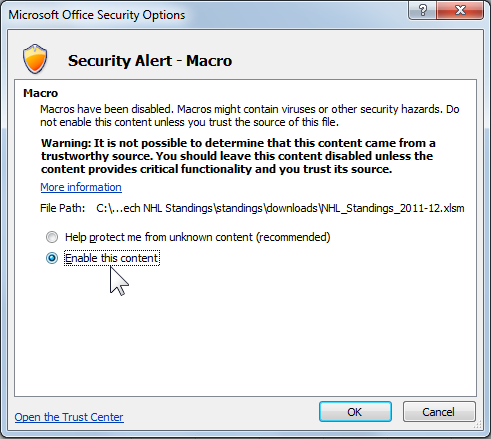
By default, Excel prevents macros from running and you will see a warning like the following just below the ribbon bar:
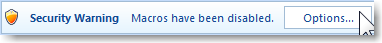
Click the Options button on the warning. Depending on the version of Excel, you may then see a Security Options popup, when
you will have to click "Enable this content" and then click the OK button.
Options Tab
The NHL_Standings_2015-16.xlsm workbook includes the default colours and other options. By changing any of these and saving
the workbook you can customize the settings that will be used when you open the workbook in the future.
The easiest way to see what any of the options does is simply to change it and click the Get Standings button. You can't hurt anything by trying different options: until you save the macro workbook none of the changes is
permanent, and even after that you can just download the macro workbook again if you want to reset everything.
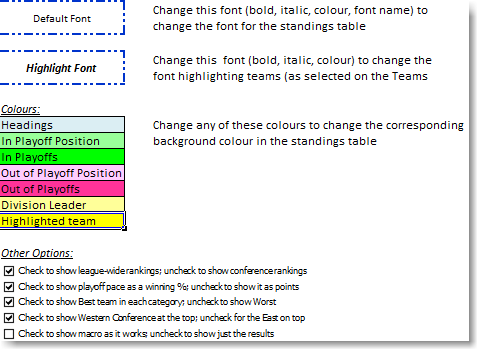
Default Font

The Default Font will be used for all non-highlighted teams in the standings as well as the column headings. The named Default Font, e.g. Calibri, Times New Roman,
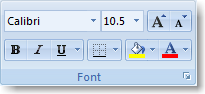
Arial, etc., will also be used for the highlighted teams. Change the Default Font settings either by right-clicking on cell A6 and choosing Format Cell then the Font tab, or
by selecting the cell and using the font controls:
I typically change the default font size for different computers so that I can see the entire standings table without scrolling.

On the Teams tab you can select which teams to highlight in the standings listing. Choose the font style and colour for the highlighted teams by changing the font style
(bold, italic, colour) in cell A8 (right-click / Format Cells or using the Font Controls). Other types of changes, such as the font name or size, won't have any effect because they
can't be controlled using Excel's conditional formatting feature, which is how the highlighted teams are formatted.
Background Colours
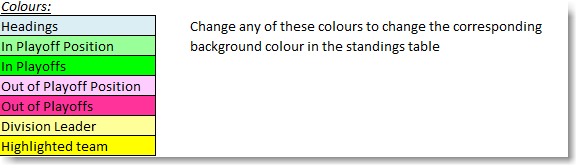
Change the background colour on any of these cells to change the corresponding section of the standings:
- In Playoff Position - background colour for the top eight teams in each conference, and also in the League column for any team in the top 16 league-wide
- In Playoffs - highlight colour in the Playoffs column for teams that have either clinched a playoff berth or that are at 0.000 (projected not to need any more points to make the playoffs)
- Out of Playoff Position - background colour for the bottom teams in each conference, and also in the League column for any team not in the top 16 league-wide
- Out of Playoffs - highlight (lowlight ?) colour in the Playoffs column for teams that have either been mathematically eliminated from the playoffs or are at 1.000 (projected to miss playoffes even if they win all of their remaining games)
- Division Leader - highlight (?!) for the name of a team that is in the top six in a conference because is in the top three of its division, but that isn't actually in top six based on its record
- Highlighted team - shading on the best (or worst) record / stat in the league (or conference), depending on the options selected below
Other Options
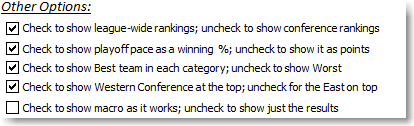
Check or uncheck the boxes to switch between:
- showing rankings and the best / worst highlights on a league-wide basis or by conference
- showing Playoffs as a full-season points total (e.g. a quick reality check - "they can't play at a 140-point full-season pace for the next 20 games") or as a winning percentage
- highlighting the best or worst teams in different categories
- listing the Western teams at the top of the list, or the Eastern teams at the top of the list
- watching Excel go through all of the formatting steps, which gets old fairly quickly, or not
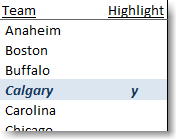
Add any character (I have used y's) in the Highlight column beside the team name to have that team highlighted in the standings using the
highlight font.
The teams selected in NHL_Standings_2015-16.xlsm will be used for any new standings created by the macro.
You can change the highlighted team for a particular day's standings by selecting or un-selecting teams on the Teams tab of the workbook created by the macros.
Standings
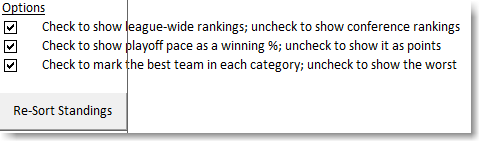
The standings will initially be formatted using the options in NHL_Standings_2015-16.xlsm. There is a set of checkboxes at the bottom of the
standings that let you switch between overall and conference rankings / highlights, Playoffs as points or winning percentage,and highlighting the best or worst.
There is also a Re-Sort Standings button
that will update the order after you have entered some what-if scenarios by, for example, giving your favourite team a couple extra wins.
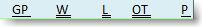
By default you can change the number of wins, losses, overtime losses, goals for, goals against, and regulation and overtime wins (ROW). You can also change the home,
away, and last 10 game records and a team's current streak. The worksheet is protected to prevent accidental changes to any of the forumlas but there is no password on it so you can un-protect it if you want.
If the data is unlocked for what-if-ing, the column heading will have a double underline rather than a single underline:
Excel Macro Source Code
Click the link below to open the source code for the Excel macros used to create the standings spreadsheet in a separate tab / window.
Even though current anti-malware should stop anything "bad" from coming through in a Word / Excel / Outlook macro, it can be a good security practice to check the actual code.
It is also a good way to see how to automate a process without going through all of the grunt work yourself to figure out the techniques involved. You can simply
copy the source code into a new module in a new Excel workbook and run the macro Get_NHL_Stats.
Show Excel macro source code.
Future Plans
I expect to keep tinkering with the spreadsheet and macros. Ideas I have in mind so far are:
- letting a user set the point calculation: that is, you could decide that overtime and shootout losses don't get a "loser point", or that regulation and overtime wins get three
points but a shootout win only gets two points (unfortunately, the data from the NHL don't give a practical way to distinguish between regulation and overtime wins);
- reversing the overall standings column to show, in effect, the draft order that will result from the current standings;
Use the feedback form to let me know if you have any other suggestions.
Feedback / Comments
Please send any comments, suggestions, or questions through the form below:.
This website, the source code, and the NHL_Standings_2015-16.xlsm macro workbook are all copyright (c) 2012-2015 by Ken Parker,
except the feedback form and the hit counter, which are provided by webhostingforfree.com which hosts this site.
There are no known errors, security or other isses with any of them, but use of this website and the macro workbook are entirely at the user's
own risk and no warranty of any type is offered.
Site hits: